Row-crop agronomy, grounded in field data
Satellite remote sensing, soil-sensor interpretation, and data behind real field decisions, written by Harva's agronomy team.
Reading mid-season nitrogen gaps through satellite greenness
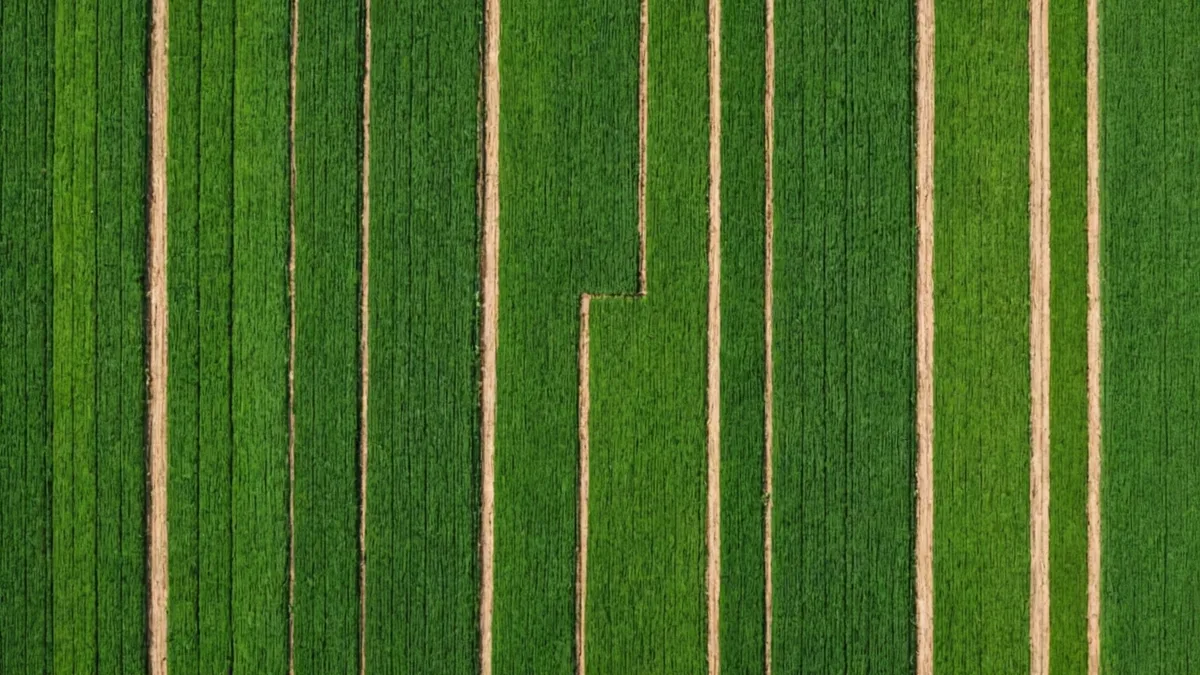
NDVI and greenness measures offer early clues, yet water stress and nitrogen deficiency can look alike. Learn to separate them before that distinction costs you at the elevator.
Read article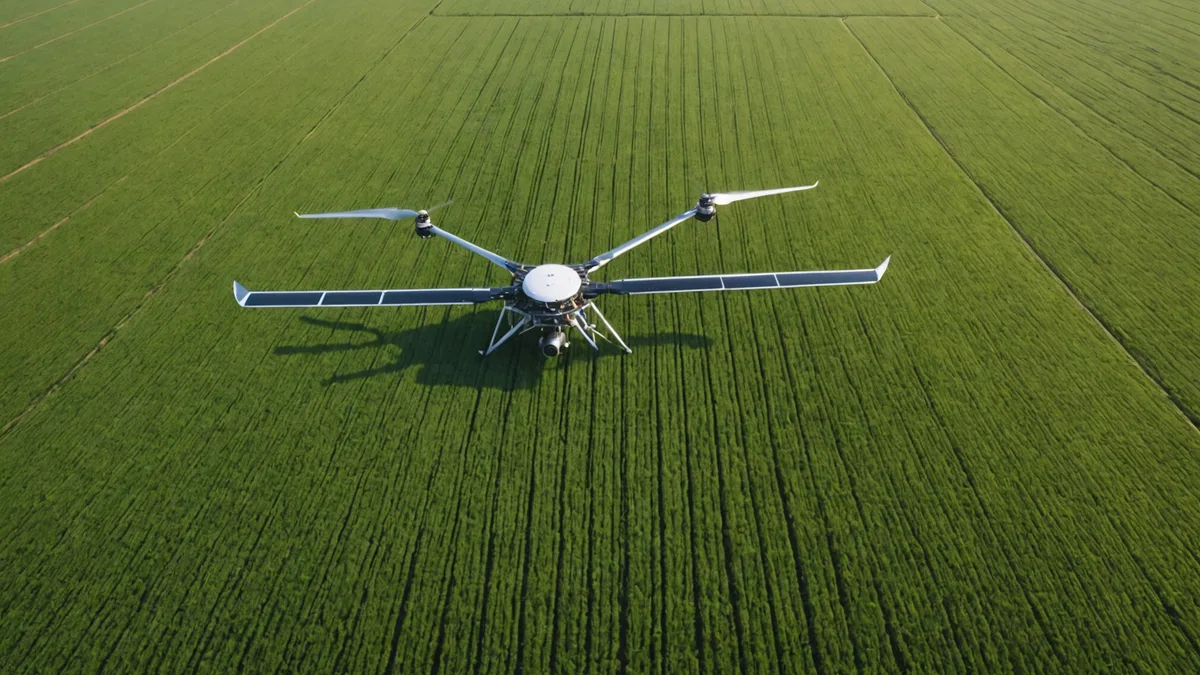
Variable-rate irrigation grid prescriptions: choosing the right zone size
More variation appears in smaller zones, along with more sensor noise. We examine the tradeoffs Harva weighs in a weekly irrigation prescription.
Read article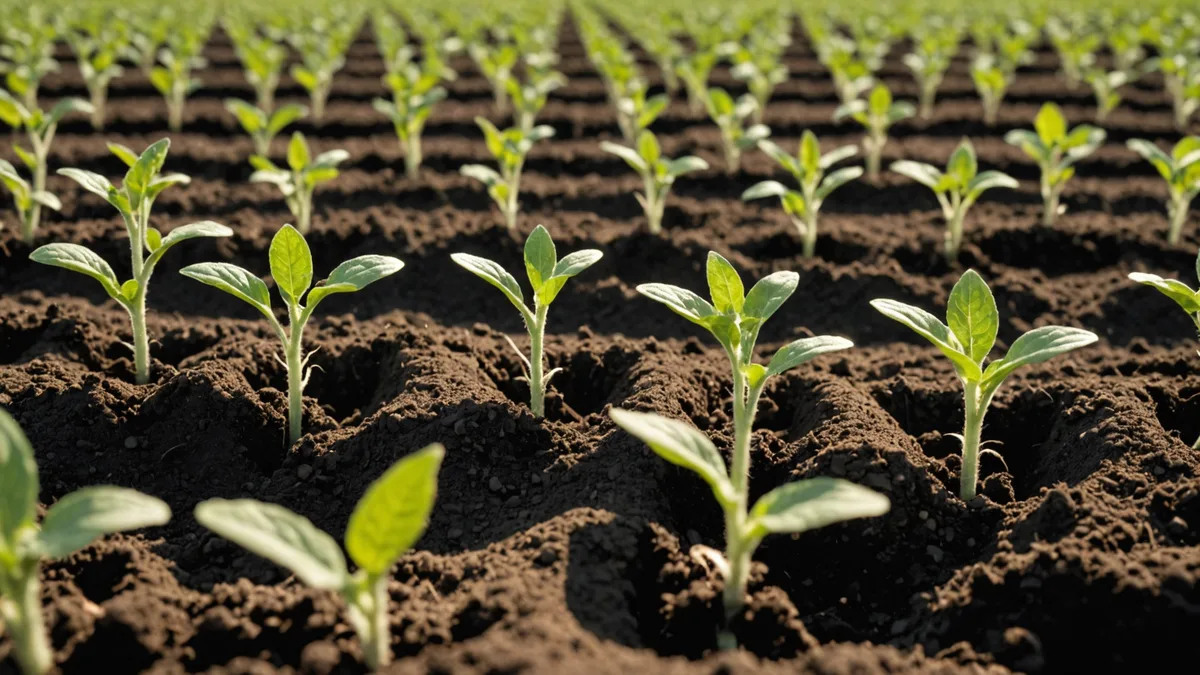
NDVI stand assessment limits in the first three weeks
At V1 and V2, satellites cannot count individual plants. Their role is to flag zones for a field walk, while ground truth remains decisive where stand estimates lose reliability.
Read article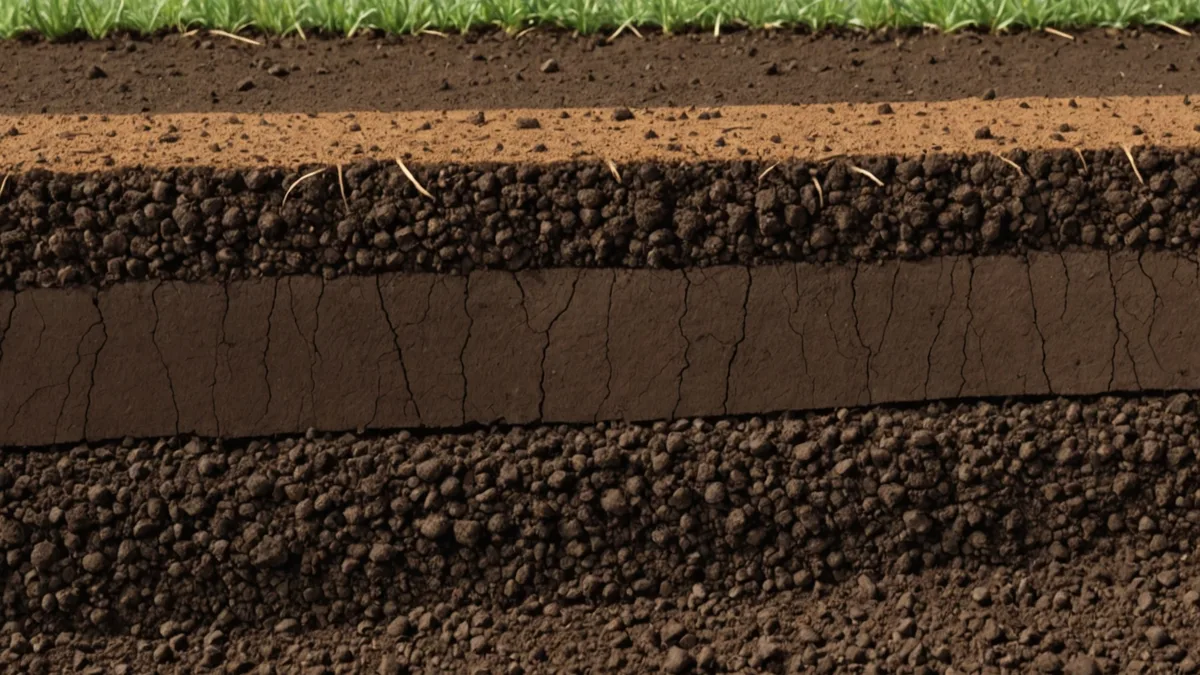
Tracing hidden compaction with soil EC maps in row-crop fields
Apparent electrical conductivity often points to an old plow pan or wheel-traffic compaction. Pair EC layers with sensor profiles to judge whether subsoiling pencils out.
Read article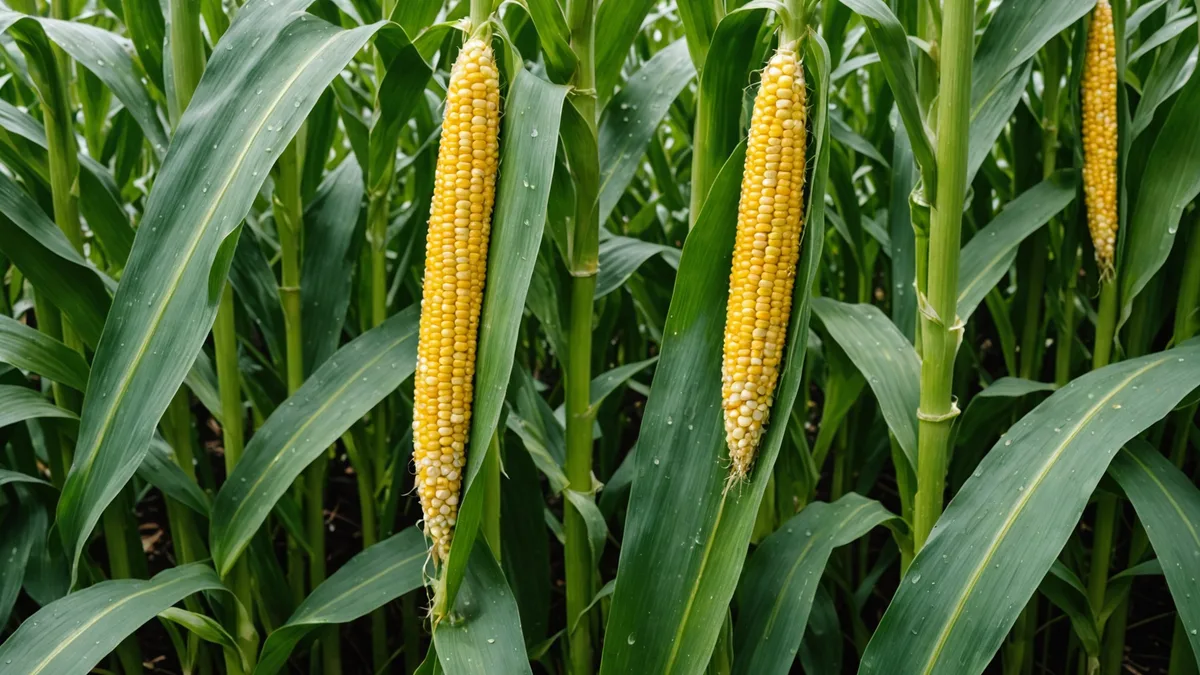
Corn fungicide timing vs. rate: evidence from the VT-R1 window
For fungicide ROI, protecting the flag leaf during grain fill matters more than application rate. We review field trials and the timing signal from canopy humidity sensors.
Read article
Soybean canopy closure at R3 from above: full versus late closure
In our satellite models, canopy structure at pod set is the strongest predictor of final yield. We explain that correlation and what delayed closure signals about pod abortion risk.
Read article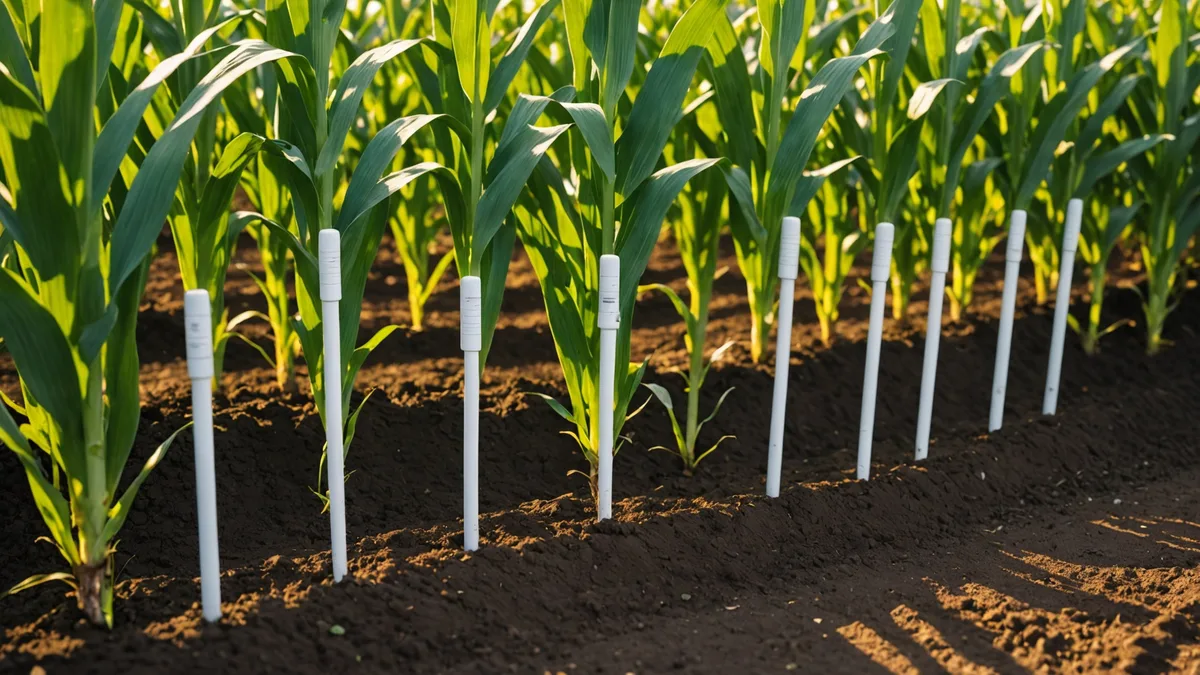
Five soil metrics row-crop advisors should check weekly
Volumetric water content, soil temperature, and apparent EC each tell a different story. We offer a practical way to read all five metrics without getting lost in dashboards.
Read article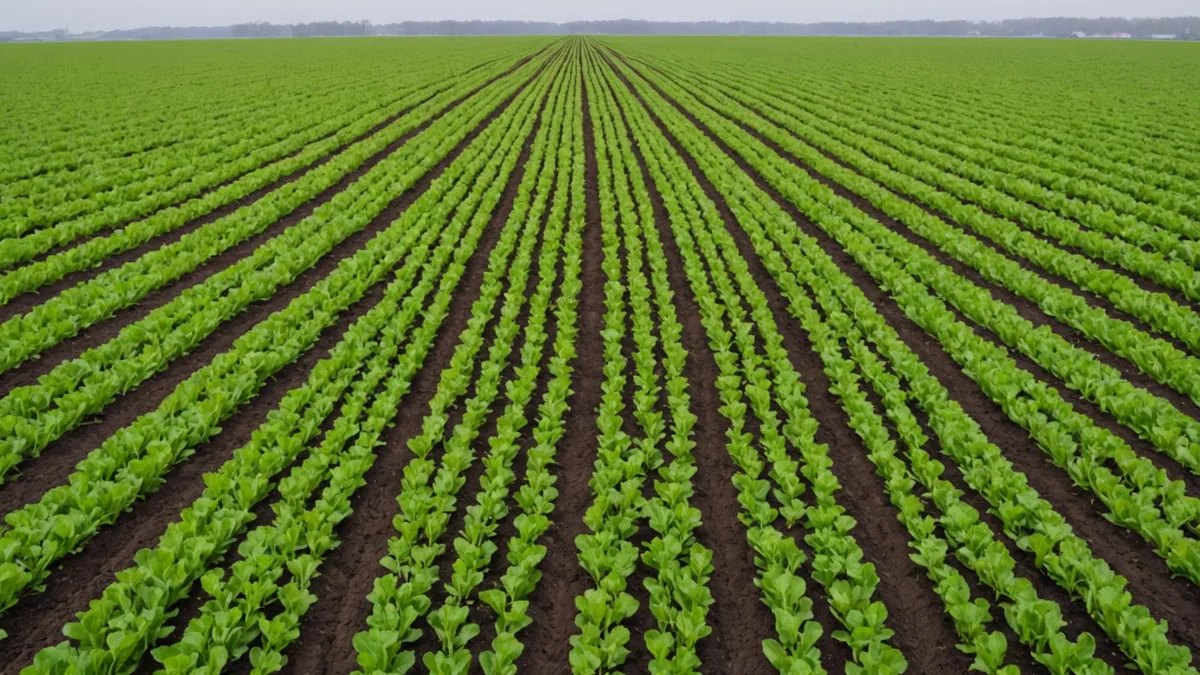
Earlier Burndown, Tighter Planting Windows
Earlier planting compresses the gap between burndown application and soil fit. We review how soil temperature and weed biomass together determine the optimal burndown date.
Read article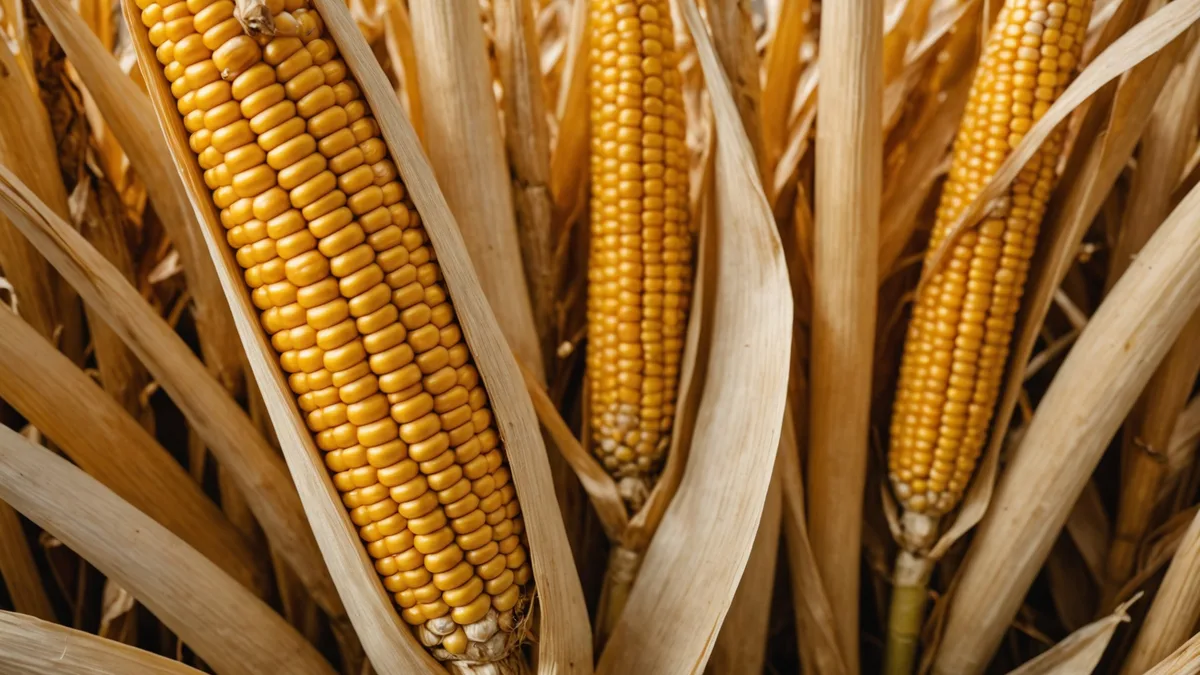
Corn drying cost thresholds and when extra drying no longer pays
At current propane prices, drying corn from 22 to 15 percent costs more per bushel than most growers realize. We examine the breakeven calculation and using sensor data to target black layer timing.
Read article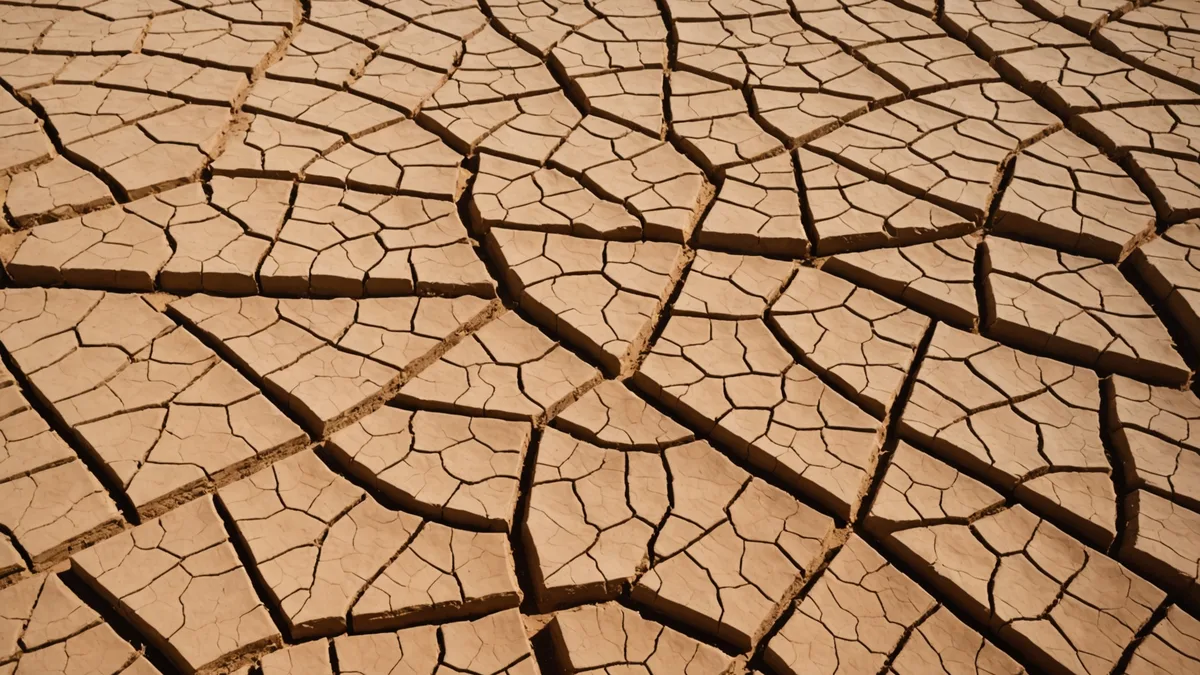
Separating drought stress from nutrient lockout with soil profiles
Late-season tip dieback and leaf roll may reflect water deficit or potassium deficiency caused by dry soil. Sensor depth profiles are the fastest way to distinguish them without pulling leaves for a lab.
Read article