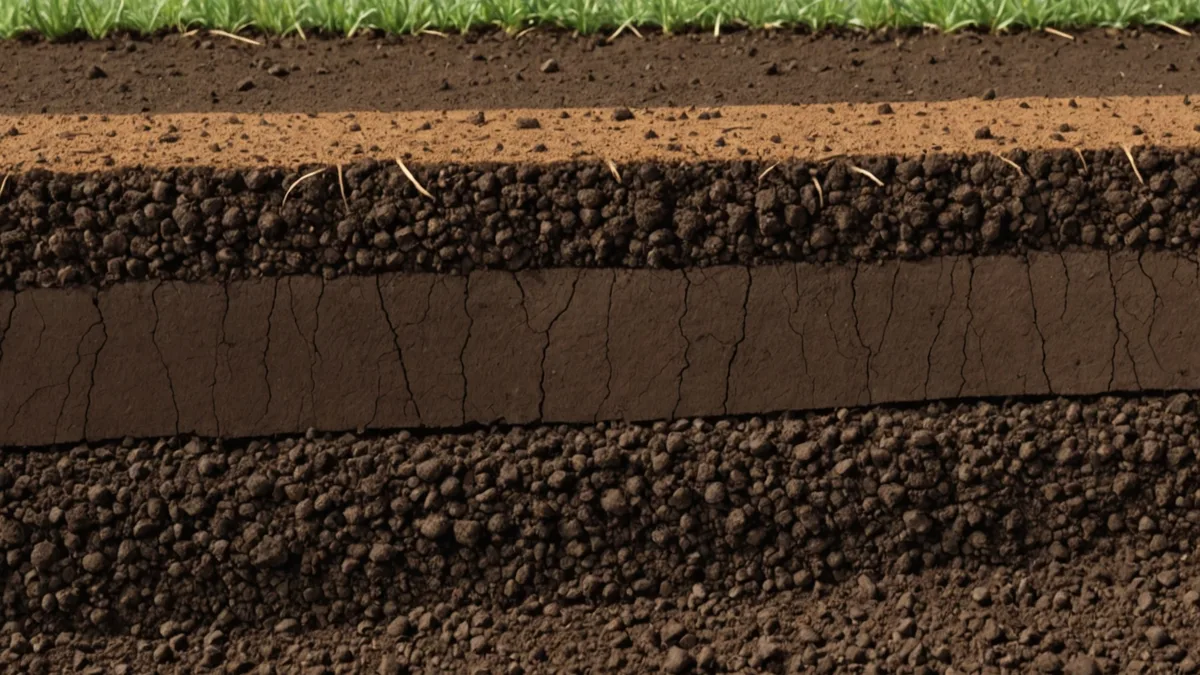
Why EC maps guide compaction decisions better than soil type maps
For row-crop growers examining conditions below the plow layer, apparent electrical conductivity surveys are among the more practical field characterization tools. The technology is not new: Veris and EM38 surveys have been commercially available for over two decades. Yet the data often remains isolated, applied to management zone delineation and then set aside. A targeted review makes it useful for diagnosing compaction.
A general soil type map provides the series name and broad texture classification, helping describe water holding capacity. It does not show the depth or severity of compaction created by a particular field's traffic history very well. An EC survey captures primary and secondary depth signatures, while the difference between shallow and deep readings often identifies the compaction layer's location and relative density more effectively than a general soil survey.
Comparing shallow and deep EC readings
At minimum, most EC surveys return two readings: shallow, roughly 0 to 12 inches, and deep, roughly 0 to 36 inches or 0 to 48 inches depending on equipment. The compaction diagnostic begins by comparing both values within each zone.
Where topsoil is fairly uniform and lacks a pronounced hardpan, shallow and deep EC readings generally move together. Both rise in finer-textured areas and fall in coarser areas. A zone whose deep EC is notably higher relative to its shallow reading than elsewhere in the field points to a finer or denser layer deeper in the profile, one exerting disproportionate influence on the deep reading. That layer could be a clay lens, or it could be compaction formed as repeated wheel traffic rearranged soil particles at a consistent depth.
Agronomically, separating a natural clay lens from traffic-induced compaction is important. A clay lens is permanent and determines drainage in that zone. A wheel-traffic compaction zone may be breakable with a subsoiler pass when conditions are right. An EC map cannot make that distinction by itself. The next step does.
Pairing EC data with sensor depth profiles
Sensors measuring soil moisture at multiple field depths provide a dynamic view of profile water movement that an EC survey cannot provide alone. Consistent accumulation at a particular depth after irrigation, followed by movement through the profile, indicates a restrictive layer there. If VWC sensors at 12 inches remain elevated for 36 to 48 hours after an irrigation event while sensors at 24 inches show minimal response, either a compaction layer or a clay lens likely lies between those depths and is slowing downward movement.
If that sensor behavior coincides with an elevated deep-to-shallow EC contrast in the same zone, two independent observations identify a restrictive layer at a consistent depth. This pairing supports a subsoiling decision better than either source alone. EC indicates spatial extent and approximate depth. Sensor dynamics show whether the layer is restricting water movement under current conditions.
Limits of EC mapping
Its limits matter. EC surveys represent the soil matrix's electrical conductivity, which responds to texture, moisture, salinity, and organic matter. Readings from a dry year differ from those in a wet year. One EC survey is a snapshot: texture-driven patterns are mostly stable season to season, but salinity or organic matter driven variation may shift. An EC map from three or more years ago may not describe present conditions accurately in saline or sodic areas if the field has undergone significant irrigation chemistry changes.
EC cannot measure compaction directly, it only supports an inference. Compaction severity is measured directly with penetrometer readings at multiple field depths. Penetration resistance above 300 psi (roughly 2 MPa) at depths between 8 and 16 inches is the standard threshold at which root elongation is significantly impaired in corn and soybeans. A penetrometer transect through zones flagged by EC contrast and sensor dynamics supplies mechanical confirmation that a subsoiler pass is warranted.
When subsoiling pencils out economically
Depending on fuel and equipment, subsoiling at 14 to 18 inches with a ripper shank carries a direct operating cost of roughly $15 to $30 per acre. That expense returns value only when compaction meaningfully limits root access to water or nutrients across enough acres for the yield response to cover it. Under average field conditions, subsoiling does not always pencil out.
Subsoiling pencils out most reliably in several situations: a documented plow pan at 8 to 10 inches depth creating anaerobic zones in wet springs and water stress in dry Julys; high-axle-load harvest traffic that produced wheel-track compaction below normal tillage depth; or mid-season root excavation showing horizontally deflected roots at a specific depth instead of vertical growth into the subsoil.
Putting a uniformly well-drained field with no documented restrictive layer through subsoiling spends money on tillage without addressing an actual agronomic problem. EC, sensor, and penetrometer results together help establish that case before equipment is committed.
How Harva uses EC data in prescriptions
Where an EC survey is available, we use the deep-to-shallow contrast map to divide the field into zones likely to have different drainage rates. Those estimates enter the irrigation prescription model. A zone with high deep EC and mid-profile water accumulation receives a lower refill setpoint than a uniformly coarse-textured zone, because the restrictive layer changes how available water in the top portion of the profile should be assessed.
This approach does not diagnose the physical cause of the restriction. Instead, the prescription conservatively reflects the restriction's likely effect on water movement. If a grower later subsoils a zone and a season of sensor data confirms reduced restriction, we revise that zone's drainage parameter for future prescriptions.
EC maps do not make subsoiling decisions automatically. They focus investigation on the zones that merit further review. You and your agronomist determine whether subsoiling makes agronomic and economic sense, using penetrometer data, root excavation, and an honest assessment of whether the affected acres justify the equipment pass. Harva supplies the spatial flag, while the field decision remains with the people who know it.