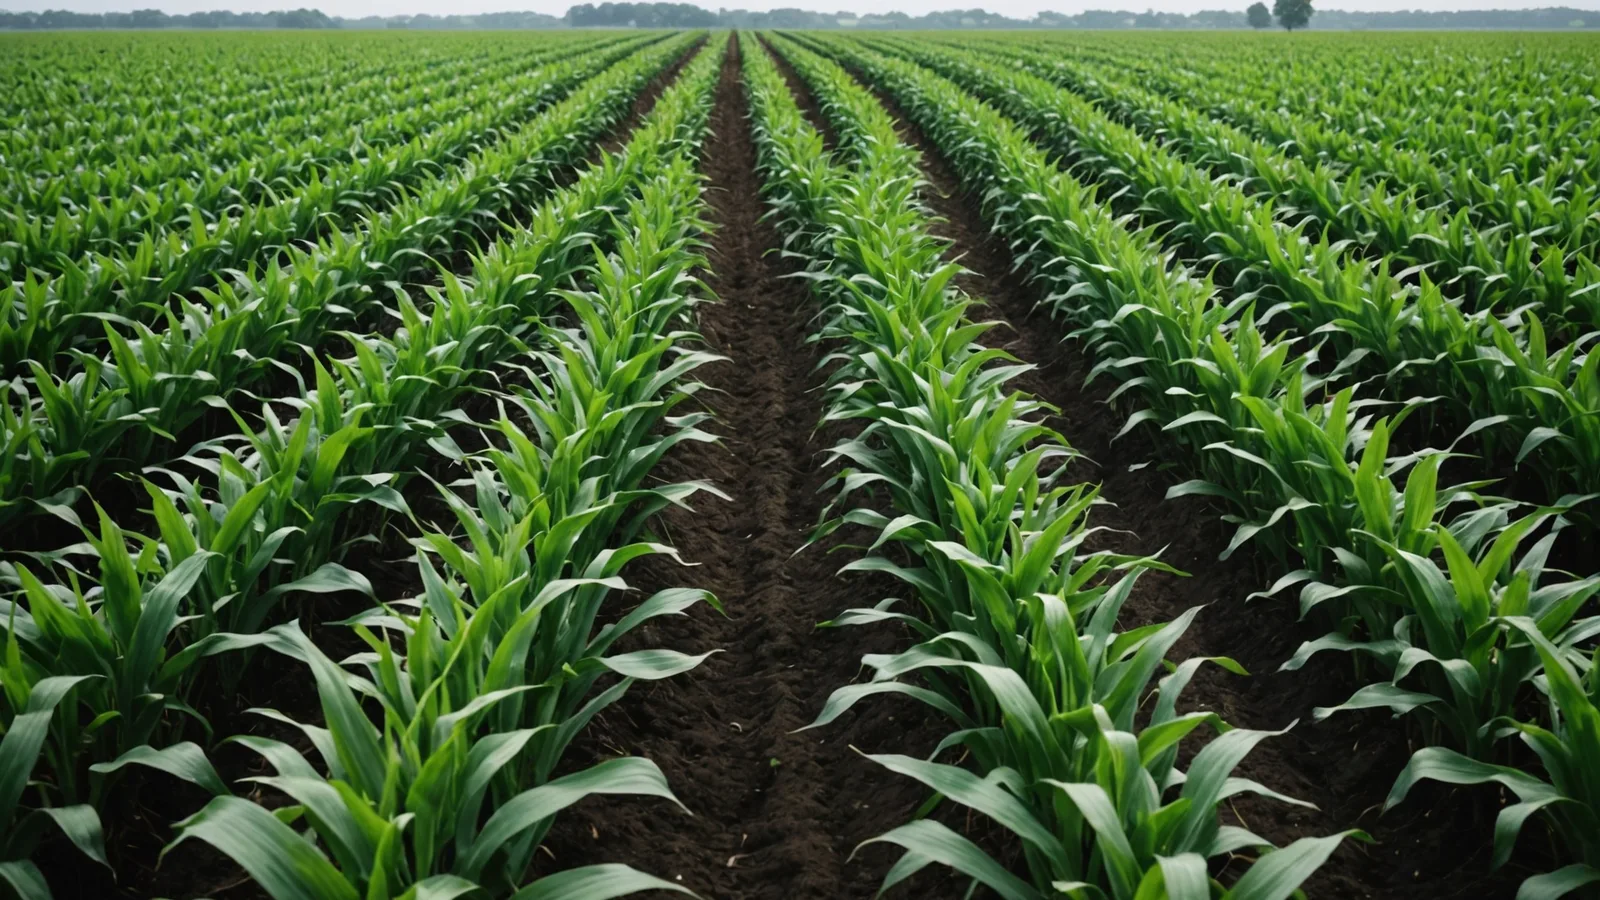
Supported Crops
Prescriptions matched to today's crop
Each model is trained for its crop's growth stages and stress patterns. Corn and Soybean prescriptions use different satellite signals and thresholds.
Row crops
Supported row crops
Harva covers the six most common row crops grown in the US Midwest and Mid-South. More crops are added in response to pilot partner feedback.
What Harva watches
What Harva watches by crop
Crops express stress differently across growth stages. Harva models use species-specific satellite bands and sensor thresholds.
Corn
- V6 through VT greenness deviation
- Fungicide timing windows from canopy humidity thresholds
- Zone-level soil water deficit from tassel through black layer
- Mid-season nitrogen uptake signals from NDRE readings
Soybean
- Canopy closure versus field-average benchmark at R1-R3
- Combined heat and water stress flags pod abortion risk
- Leaf spectral indices flag potassium and sulfur deficiency
- Canopy density and humidity indicate white mold pressure probability
Wheat
- Early NDVI estimates of tiller density guide nitrogen splits
- Temperature and leaf wetness hours flag stripe and leaf rust pressure
- Heading uniformity flags mark zones at risk for late frost damage
- Track grain fill rate from Jointing through soft dough
Cotton
- Squaring stage canopy cover flags monitor first-fruit set
- Heat accumulation and water deficit signal boll retention stress
- Heat units and boll maturity estimates set defoliation timing windows
- Post-emergence greenness maps show stand establishment variation
Sorghum
- Canopy height estimates indicate panicle development stage
- Rolling soil water deficit guides drought avoidance scheduling
- Grain fill humidity accumulation signals mold and head blight risk
- Yield potential zone maps use vegetative-index divergence
Sunflower
- Late-season canopy reflectance estimates head diameter
- Flowering-period soil moisture profiles indicate Sclerotinia risk
- Early-season temperature and humidity indicate downy mildew pressure
- Head color change rate detection flags harvest timing
Ready to start
View prescriptions for your crops this season
Start a 30-day pilot on your fields. Before your next field day, receive a prescription based on current satellite data and your field boundaries.